
With markets back again at record highs, the question is where do we go from here. These four charts are key to what we think will be driving markets in the coming year, as discussed in LNWM’s Q1 2021 Economic Outlook:
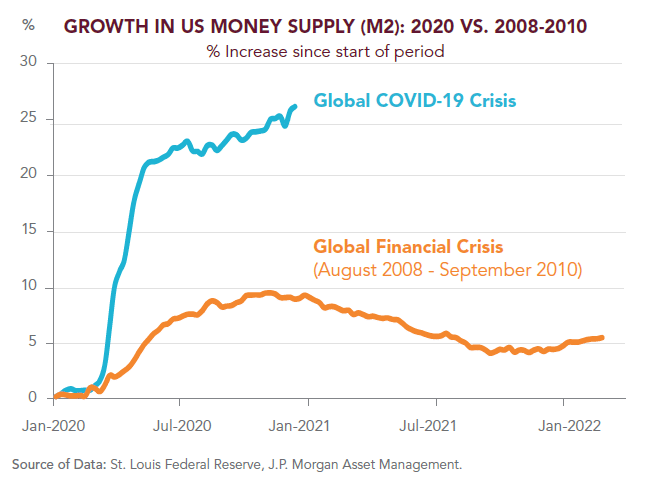
***The amount of support provided by the Federal Reserve and the US government to financial markets and the economy in 2020 was truly unprecedented, far higher than during the global financial crisis of 2008. To date, tremendous liquidity remains available – see growth in money supply below — to fuel the economy and asset prices, as well as inflation. At its latest briefing, the Federal Reserve said it remains committed to keeping its key interest rate near zero and buying $120 billion in bonds each month.
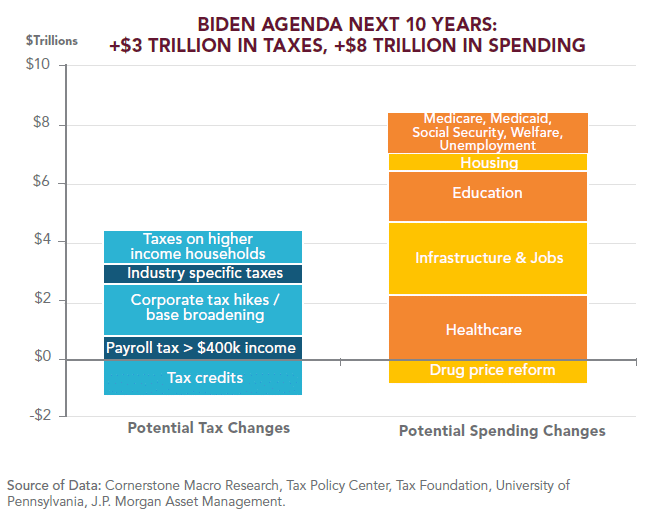
***Current expectations are for sizeable increases in US government spending and taxation. The Democratic Senate wins in Georgia have increased the probability that this trend will be in place for at least several years, although we believe some of the most ambitious proposals will be amended or shelved as a result of difficulty passing them through Congress.
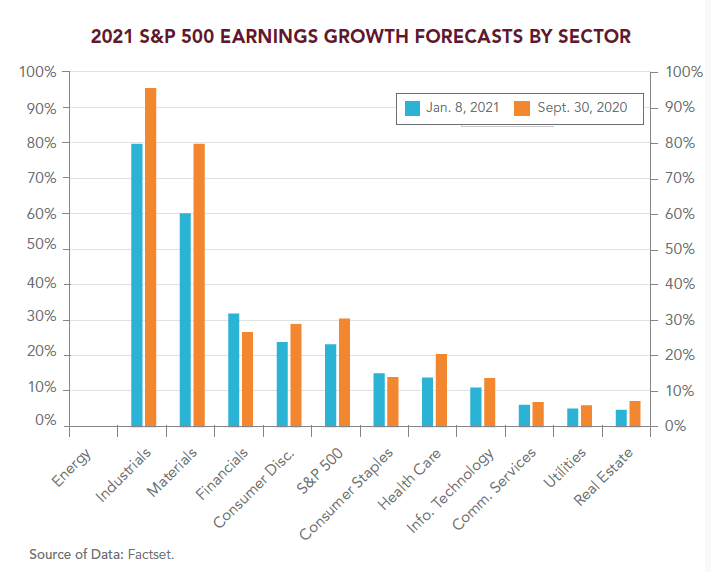
***Consensus analyst estimates currently are for a 23% rebound in S&P 500 earnings for 2021 (vs. a drop of 13% for 2020). Industries hurt the most by the pandemic and resulting lockdowns are expected to have a significant rebound in earnings as the US economy recovers — see chart below. (The energy sector does not appear in the chart because it posted losses in 2020.)
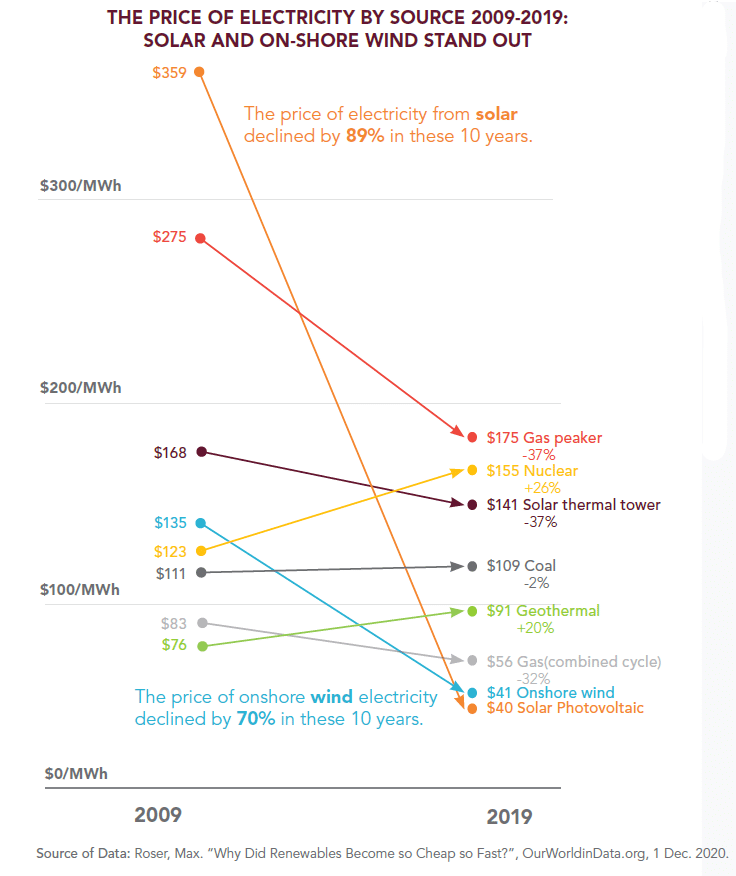
***Renewable energy prices have dramatically decreased, as production of solar panels and wind turbines has soared over the last decade. It is projected that renewables accounted for 90% of new energy capacity added globally in 2020. We believe renewable power investments stand as much on their fundamentals today as on their ESG principals.
Learn more
Read our paper,
Q1 2021 Economic Outlook

